Assured Certification
Rating (449)
Rated 5 out of 5
Microsoft Power BI: A Complete Hands-on Training
(English)
Starting at ₹14 Per Day
Select iJaipuria’s Growth Accelerator Plans
Enroll in this course and gain access to 100+
additional industry-relevant courses
________ or ________
Assured Certification
Rating (1207)
Rated 4.5 out of 5
Course Highlights
Course Highlights
- Complete End-to-end Power Bi Report Development Using Real-world Business Case
- Implement Your Bi Skills in Your Professional or Personal Projects
- Power BI's Complete ETL Process - Data Analysis, Data Integration, Transformation, Modelling and Visualization
- Understand and Explore Your Data Using AI-based Power BI Visuals
- Learn and Implement Dax Calculations
- Analyze Your Data for Effective Storytelling Using Unique Power BI Features Like - Drill Through, Custom Tooltips, Bookmarks
About the Course

04 hrs 04 mins

13 Modules

Q&A

12 Month Access

Hands-on-Projects

Assured Certification
Topics You Will Learn in This Course
In this course, you’ll learn all the unique features of Power BI Desktop to help you understand and gain confidence in –
- Data Integration
- Data Transformation
- Data Modelling
- Data Exploration
- Data Visualization
- Storytelling
We’ll be taking a practical approach by first understanding the business case. Then, as per our requirement, we will work on a step-by-step practical approach to clean our data, mashup, and then start our work on visualizations.
In this extensive hands-on course, you will be in the shoes of a Data analyst who is developing a Power BI report for the Chief Marketing Officer and Chief Financial Officer to help them uncover the business insights from their data and track major Sales and Financial KPIs.
You will work and do training in Sales and market share analysis data where your focus would be to find out which product categories and manufacturers are generating the most revenue. You will also be doing a competitive analysis against other top manufacturers.
- We’ll start training by integrating the data from multiple data sources and then performing a lot of transformations to prepare and clean our data and make it ready for reporting.
- Once loaded, we’ll start making a data model and working our way towards the visualizations.
- We’ll be doing a lot of data analysis and exploration by asking essential questions throughout the course.
- We will answer some common questions while doing Sales analysis through DAX calculations and creating our measures and calculated columns.
- Our final goal will be to design a professional sales analysis report that the end users can easily use to gather insights and help them take action.
- Furthermore, we’ll be using multiple AI-based Power BI visuals to do some advanced analysis of our data.
Course Structure
- Power BI Overview 11:54
- Business Scenario 07:40
- Walkthrough: Home ribbon 06:34
- Walkthrough: Report, Data and Model Section 06:53
- Integration from multiple data sources 06:35
- Data preparation 03:09
- Split columns | Fill down | Column from examples 06:01
- Remove rows | Transpose 03:17
- Append Queries | Add Conditional Column 07:25
- Optimizing the Data Model 06:52
- Setting up relationships 10:15
- Cross Filter Direction 06:33
- Top N Analysis 07:29
- Competitor Analysis – Creation of Groups | Treemap visual 06:26
- YoY Analysis with drilldown capabilities 08:23
- Slicer | Creation of hierarchies 06:18
- Measures vs Calculated Columns 08:10
- This year vs last year analysis 12:12
- % Growth Calculation 06:19
- Conditional formatting 04:39
- Using .JSON themes 06:39
- Trend Analysis and using images 06:52
- Creation of bookmarks to present your story 06:43
- Adding buttons for navigation 07:48
- Adding toggle buttons using Selection Pane and Bookmark Pane 07:02
- Adding Background | Azure Maps | Text boxes | Logo 14:02
- Decomposition tree 05:38
- Smart narrative 06:16
- Key Influencers 05:57
- Quick Insights 05:45
- Custom report tooltip 05:47
- Drillthrough 05:35
- Introduction to Power BI Service 08:52
- Performance analyzer 02:58
- Export the report to Excel 04:08
Your Instructor

Deepesh Vashistha, is a Microsoft Certified BI Consultant proficient in Power BI, MS-BI stack (SSIS/SSAS) and Azure technologies and has implemented BI solutions for over 50 mid and large-size industries across India, US and Middle-East.
He specializes in analytics and analytical tools that work seamlessly with business intelligence, data warehousing, architecture and data modelling that help organizations optimize their operations and build a competitive advantage. Over the years he has worked on many BI and data warehousing projects and has been providing corporate and online training to professionals.
Deepesh Vashistha
MS BI ConsultantCourse FAQs
This course will help you learn Power BI by diving deeper and following a practical approach with a business scenario to design and develop reports, from Data integration, transformation, and data exploration with DAX calculations and visualization.
- Anyone who has a basic to intermediate understanding of Power BI and is looking to take the reporting to the next level
- Anyone who is looking to learn Power BI with a practical use case
- Anyone who wants to design and develop professional reports
- This course is not for you if your focus is on Power BI Service. This course is intended to improve your development and analytical skills
- Anyone who wants to enhance their skill set as a data analyst or BI consultant
- A windows PC. Power BI is not supported on Mac or LINUX
- A basic to intermediate understanding of data analysis
- Upon completing this course, you will the required understanding and confidence to take up a Power BI project on your own with the skills learned in this course.
- You will also be able to Analyze your data for effective storytelling using unique Power BI features like – drill through, custom tooltips, and bookmarks.
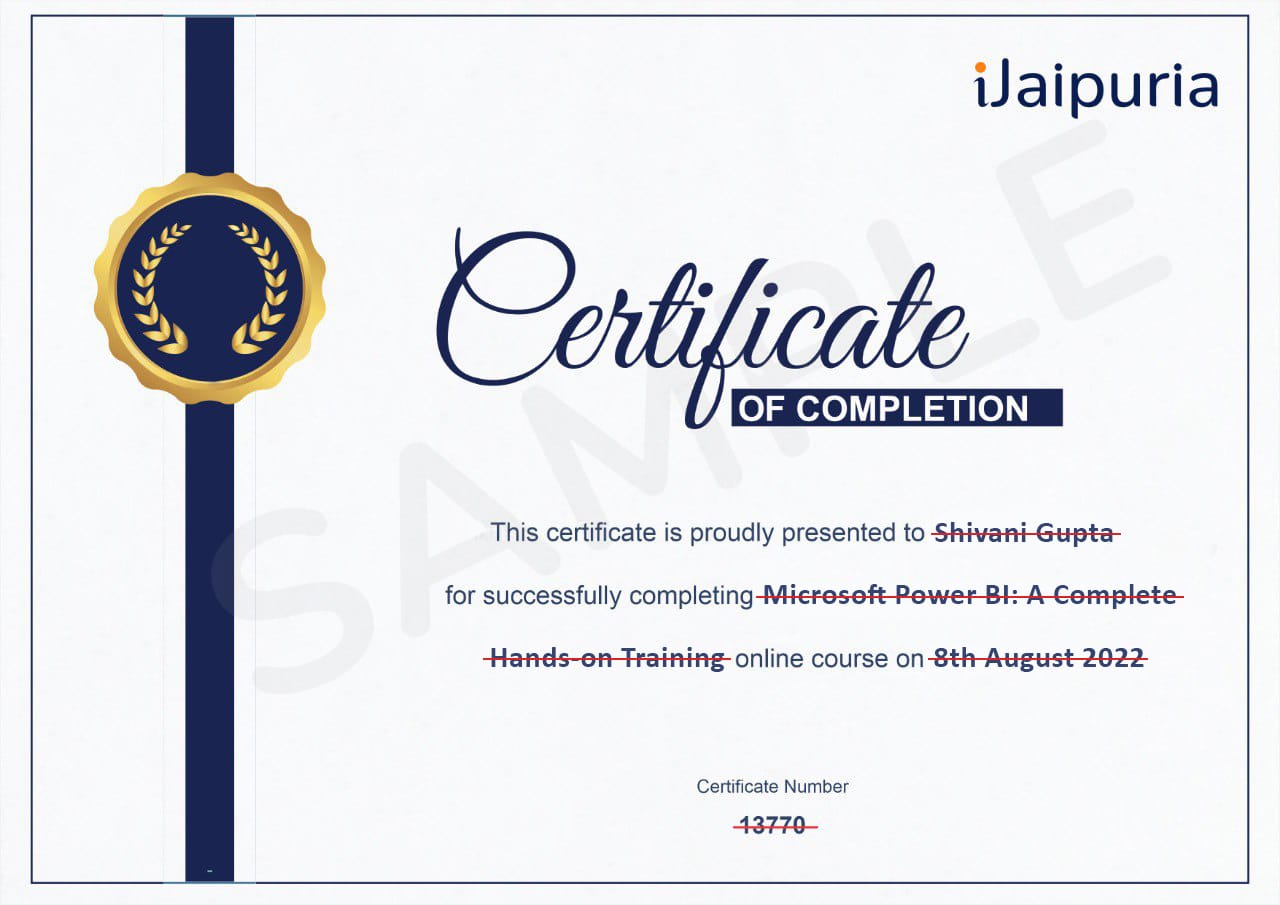
Earn a Certificate
After finishing the course, you will get a Certificate of Completion.
Demonstrate Your Commitment
Be a growth-driven professional and advance your career by learning new skills
Share your Accomplishment
Showcase your verified iJaipuria certificate on your social media platforms and CV